News
NatureMaps launched, interactive mapping for Citizen Science projects
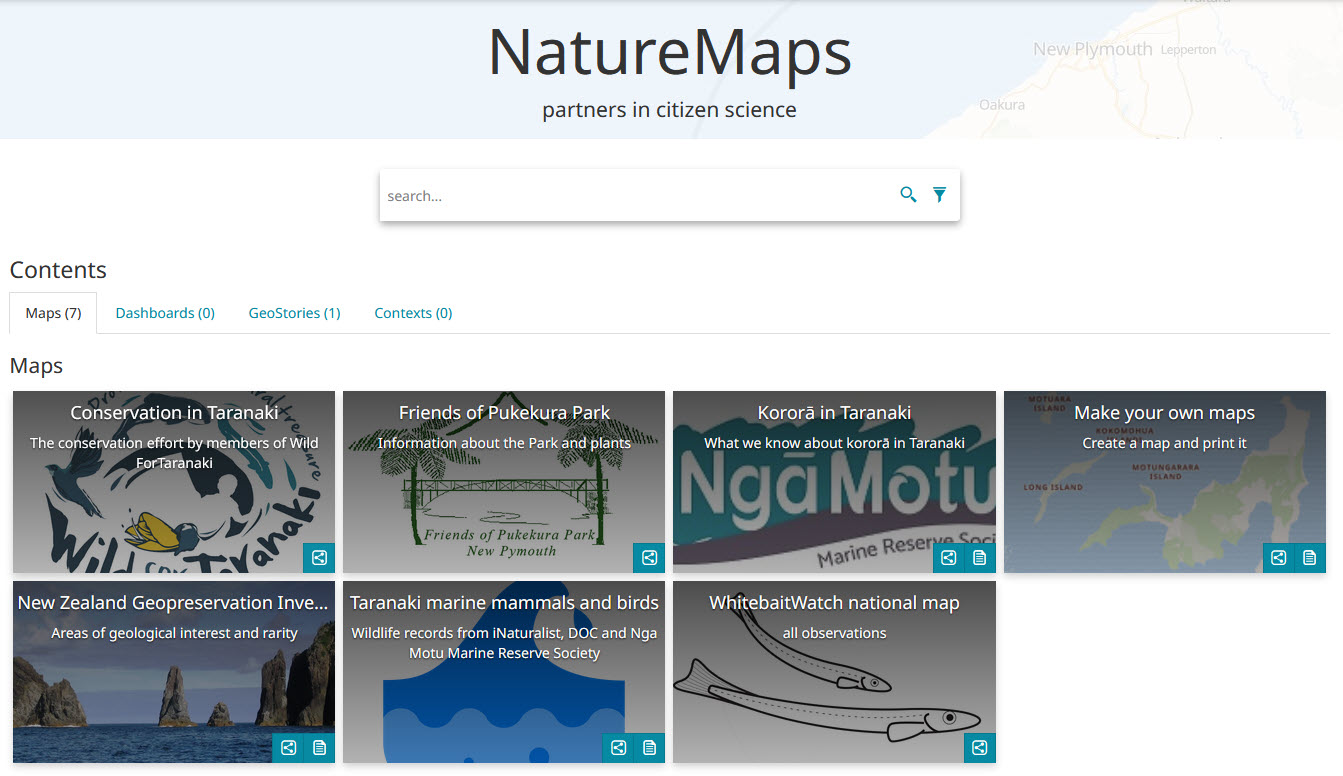
Citizen Science - projects, outputs and useful resources
Citizen scientists are making great contributions to our knowledge of the natural and physical world. This site is a showcase for New Zealand projects that you may like to explore, use, or contribute.
Thanks to the TSB Community Trust for supporting this initiative
This Curious Minds Public Participatory Platform project compared two restoration sites, one at Nowells Lakes, the other at Rotokare Scenic Reserve.
![]()

Mapping changes over time
How have things changed over time?
Often we forget, or the numbers on a spreadsheet just don't make that much sense. For example, these heatmaps are a way to show how the distribution of kiwi has changed. The most recent period has many more records, mostly from listening stations.

Previous page: Analysis
Next page: Information